Analysis
The "Analysis" frame displays the analysis results.
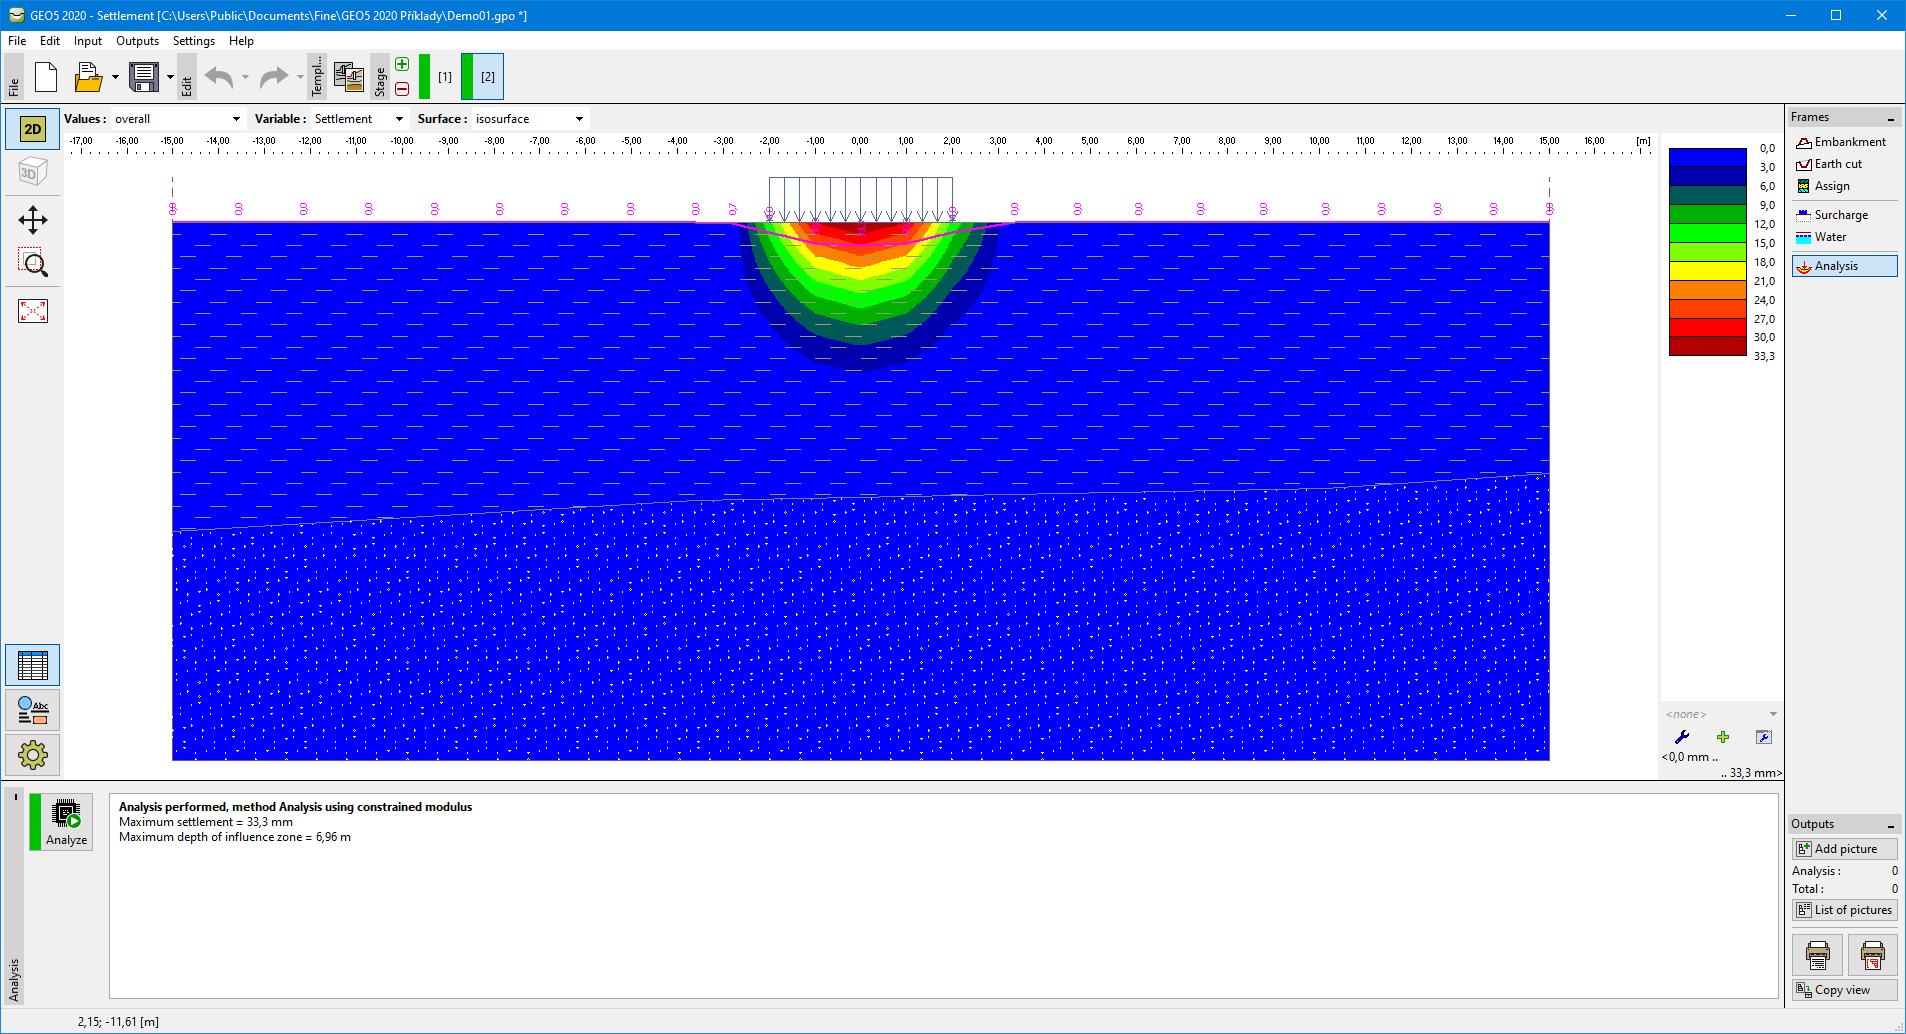
It is always required to model the structure using construction stages. First construction stage represents the original state, so the settlement is null. New surcharges or embankments are added in further construction stages, where the terrain settlement is calculated. Information about the analysis process, maximum settlement, depth of the deformation zone are listed in the window in the bottom part of the frame.
In consolidation analysis (set in the frame "Settings") this section of the frame allows us to enter consolidation parameters.
The settlement is calculated using the analysis theory, which is input in the tab "Settlement". The depth of deformation zone is defined either by input incompressible subsoil, method of restriction of the primary stress magnitude, or by theory of structural strength.
The results, as the main output, are displayed on the screen. To view the results, use the horizontal bar in the upper section of the screen and "Drawing Settings : Analysis" frame.
The frame "Drawing Settings : Analysis" allows for specifying:
- drawing parameters: parameters to display depression line and influence zone, to draw tilted sections, isosurfaces and isolines, etc.
- option to store individual views
The bar contains the following control items:
- selecting values for visualization - either total values, or their change during the last calculation stage or their change in comparison with previous stages can be plotted. The setting is available only in problems where it makes sense. It is therefore possible to display the change of stress, settlement or deformation in comparison with previous stages - however, always the current depth of influence zone is plotted.
- selecting variables
- SigmaZ,tot - overall vertical total stress [kPa, ksf]
- SigmaZ,eff - overall vertical effective stress [kPa, ksf]
- Pore pressure - stress due to water [kPa, ksf]
- Settlement - settlement of a point [mm, feet]
- Deformation - relative settlement of a layer [-]*1000
- plotting option (do not plot, isosurfaces, isolines)
The color range is visible on the right part of the desktop. The buttons for setting the color range are located below.
 Frame "Analysis"